Lightning Strike Statistics: Fascinating Facts You Need to Know
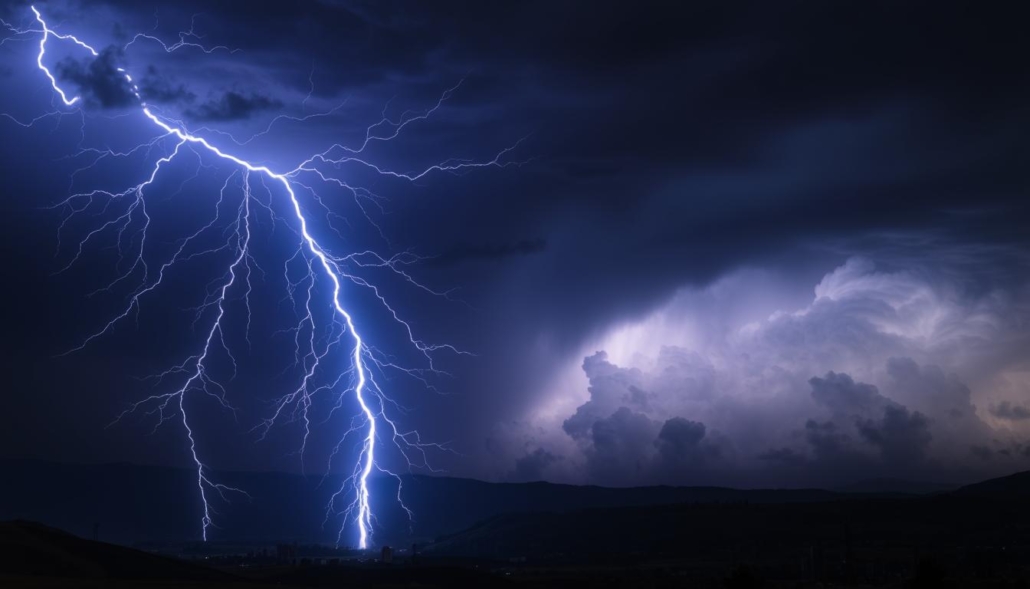
Every year, nature’s raw power claims tens of thousands of lives through a force most never see coming. Globally, over 24,000 fatalities occur annually due to electrical storms, with injuries surpassing 240,000. These numbers aren’t just abstract figures—they represent real risks tied to geography, behavior, and even biology.
In the U.S., odds vary dramatically. For example, 1 in every 10,000 Americans will experience a direct encounter in their lifetime. Men face four times higher risk than women, particularly those aged 20–45. Why? Frequent outdoor activities and occupational hazards play major roles.
Geography also shapes danger zones. Regions like Central Africa see elevated rates due to mountainous landscapes and humid air currents. Even within the U.S., states with frequent thunderstorms—like Florida and Texas—report higher incidents compared to arid areas.
Understanding these patterns isn’t just about curiosity. It’s about saving lives. Public safety campaigns and improved forecasting tools rely on this data to reduce risks. By recognizing where and how these events occur, communities can build smarter preparedness strategies.
Understanding Lightning Strike Statistics
Unseen forces in thunderstorms carry risks that data helps us decode. By analyzing injury patterns and environmental factors, researchers identify critical trends that shape safety measures. This knowledge bridges gaps between raw numbers and real-world prevention strategies.
Defining Lightning Strike Statistics
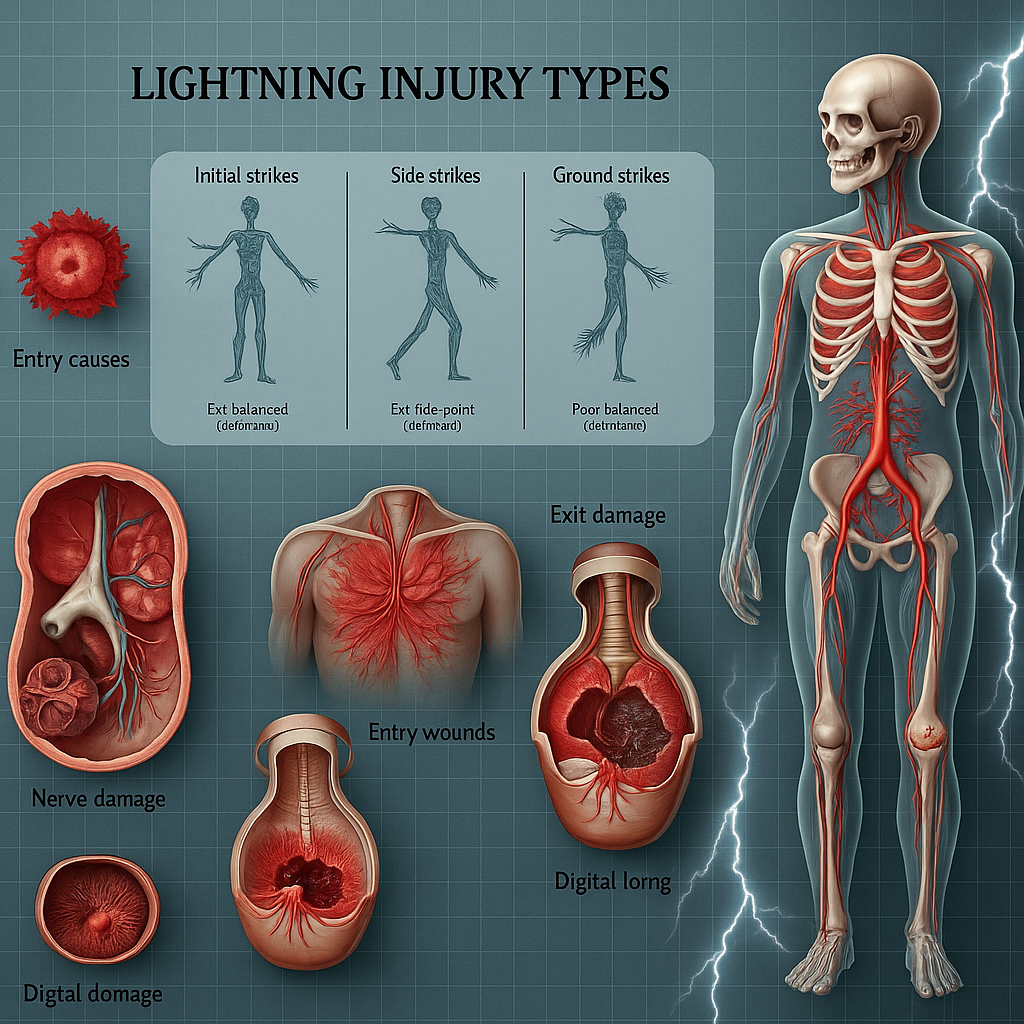
Electrical events cause four primary injury types. Direct contact accounts for 5% of cases, while side splash—energy jumping from nearby objects—causes 33% of injuries. Ground current and contact mechanisms complete the list, each requiring distinct safety responses.
Diagnosis relies on witness accounts and physical signs like burns or cardiac irregularities. For pregnant individuals, these incidents carry dual risks—fetal mortality reaches 50% when exposure occurs. Medical protocols prioritize immediate assessment of neurological and cardiovascular damage.
Historical and Demographic Trends
Men represent 80% of victims globally, a pattern unchanged since the 1950s. Outdoor jobs in construction or agriculture elevate exposure, as do recreational activities like hiking. Peak vulnerability spans ages 20–45, aligning with workforce participation and adventure sports popularity.
Seasonal spikes occur during summer thunderstorms across the U.S. South and Midwest. Historical records show farming communities once faced higher risks before weather forecasting improved. Today, targeted education reduces incidents among high-risk groups like golfers and boaters.
Lightning Safety and Prevention Insights

Surviving nature’s electric fury requires more than luck—it demands precise strategies rooted in decades of research. Modern protocols combine real-time weather tracking with behavioral science to protect vulnerable populations. From anglers to construction crews, tailored approaches save lives where risks run highest.
National Safety Protocols
The U.S. implements rigorous guidelines developed through meteorological studies and injury analysis. These standards prioritize shelter identification—like enclosed buildings or metal-topped vehicles—over makeshift cover. High-risk activities, including recreational fishing, receive special focus due to their 10% fatality rate in storm-related incidents since 2006.
Educational campaigns target common misconceptions, such as the belief that rubber-soled shoes offer protection. Instead, protocols emphasize immediate action when thunder roars, regardless of visible storm clouds. Mobile alert systems now deliver location-specific warnings, reducing response times in exposed areas.
Preventative Strategies That Work
When caught outdoors, assume the crouched “safe position” with feet together to minimize ground current exposure. Key warning signs demand attention:
- Crackling noises or static sensations
- Unexplained hair standing upright
- Sudden metallic tastes or ozone smells
Indoor safety requires avoiding plumbing and electronics during storms. Survivor data shows proper shelter reduces injury severity by 72% compared to open-air exposure. Annual drills in storm-prone regions reinforce these life-saving habits.
Impacts on Health: Lightning Deaths and Injuries
Surviving an electrical event doesn’t guarantee a return to normalcy. While 90% of victims live through these incidents, three-quarters face lasting health battles that reshape their lives. From immediate cardiac crises to delayed neurological damage, the body endures complex trauma even after visible wounds fade.
Injury Mechanisms and Outcomes
When electricity surges through the body, it disrupts cellular function and organ systems. Cardiac arrest strikes first in 80% of lethal cases, while respiratory failure claims others. Survivors often report:
- Burns resembling fern patterns (Lichtenberg figures)
- Broken bones from muscle contractions
- Temporary deafness or vision loss
These marks usually vanish within days, but internal damage lingers. “The real danger hides beneath the skin,” explains emergency protocols, emphasizing post-event monitoring for delayed complications.
| Symptom Type | Immediate Effects | Long-Term Risks |
|---|---|---|
| Cardiac | Arrhythmia, arrest | Chronic chest pain |
| Neurological | Confusion, seizures | Memory loss, mood disorders |
| Sensory | Hearing/vision disruption | Cataracts, tinnitus |
Long-term Health Consequences
Months after exposure, many develop new symptoms. Cataracts emerge in 30% of cases, often requiring surgery. Neurological damage manifests as:
- Persistent fatigue disrupting work
- Personality changes straining relationships
- Chronic pain limiting mobility
Nearly half of survivors report career changes due to health limitations. With proper rehabilitation, some regain function—but 25% face permanent disabilities altering their lifetime trajectories.
Recent Analysis and Trends in Lightning Phenomena
Modern tracking systems now reveal patterns that redefine how we approach electrical storm safety. Between 2006 and 2019, U.S. data shows 10% of fatalities occurred during recreational fishing—more than any other activity. This trend persists despite advanced forecasting tools, highlighting gaps in public awareness.
Data Analysis from Past Years
High-risk activities share common traits: open spaces and delayed shelter access. Key findings from the past decade include:
- Boating and camping account for 22% of incidents
- Summer afternoons between 2–6 PM pose triple the risk
- Survivors under age 30 recover faster than older adults
Researchers measure discharges at 30 million volts—enough energy to power 950 homes for a day. These figures drive innovations in protective gear and evacuation protocols.
Implications for Future Safety
New detection systems analyze cloud charge distribution, providing 45-minute warnings—double previous lead times. Priorities include:
- Installing weather shelters near popular fishing spots
- Developing mobile apps with real-time danger zones
- Training first responders in multi-system injury care
As climate shifts alter storm frequency, historical data guides infrastructure updates. “Prevention now focuses on merging technology with human behavior,” notes a 2023 safety report. These strategies aim to cut deaths by 40% within five years.
Conclusion
The power of electrical storms remains a global challenge, with 24,000 deaths annually and injuries affecting 240,000 people worldwide. In the U.S., an individual’s lifetime risk stands at 1 in 10,000—a figure demanding attention despite modern forecasting tools.
Prevention hinges on recognizing danger signs and seeking proper shelter immediately. National lightning safety initiatives prove most effective when combining real-time alerts with public education targeting high-risk groups like outdoor workers and recreation enthusiasts.
Future progress relies on adapting strategies to climate shifts and demographic patterns. By prioritizing research and community outreach, societies can reduce vulnerabilities to this unpredictable force of nature.